For personal reasons, this year has been quite different to those previously. So, like many football teams, my season is effectively going to end early this year.
On Friday, I'm flying off with my family for a nice six week break. We'll be visiting Malaysia and the Philippines, soaking up the sun and generally relaxing. I've been to South-east Asia several times before and it's a fabulous part of the world.
For me personally it will be a chance for rest and recuperation, and I will recharge my batteries ready for the rest of the year. Hopefully it will also herald a good trading season come August.
So, apologies for a rather erratic set of posts this year, but I do foresee a return to a more steady, continuous set of posts in the new season.
I hope you all have a good end-of-season trading/betting, and I might touch base with you all again come mid-June when I get back.
Monday 22 April 2013
Saturday 13 April 2013
Testing your strategies - part II
In my last post, I showed you how to collect the raw data from www.football-data.co.uk and to use that data to apply a basic strategy against every single match (all 380) in one fell swoop to see if that strategy was a winning idea. Sadly, it wasn't, but this was a reasonable first stab at some back-testing, and hopefully even that simple example will have triggered some ideas in you that you want to test.
As you get more into this, however, you will quickly start to see some problems with the approach I have outlined. Many strategies rely on looking at previous results to assess current form or to help with the selection process of a particular strategy. The back-test that I showed in my last post provides no method to select a team’s previous match or indeed their previous n matches.
There are a few considerations when looking to solve this problem:
- We don’t know the number of games a team has played so far.
- We don’t know if a team’s last match was played at home or played away (different column in the raw data).
- We don’t know how far back a team’s last match was (i.e, the last one could have been postponed).
Strategy Idea:
Let’s take a concrete example that we want to test. I have an amazing idea (yes, another one) to lay any team below odds of 3.00 who’s last match was at home and where they lost that match without scoring a goal. So, if a team lost their last match at home to nil, then they will become a lay target. Okay, so how do I achieve this? I need to:
- Check the odds in their current match (are they equal or less than 3.00?)
- Check if they were at home in their last match.
- Check if they lost their last match.
- Check if they scored a goal in their last match.
If all these qualifying criteria equate to true, then I must assess whether I would have won/lost money laying such a team. In other words, what would my P/L have been?
Previous matches:
So, how do we solve these problems? Well, as in most things in life, there is more than one way to skin a cat. I have a method that I have come up with to allow me to overcome these issues. Doubtless, my solution is not the most elegant or effective around as I’m certainly no Excel guru – but it seems to work okay and should allow you to satisfactorily test a wide variety of strategies that require the resolution of these issues.
Below you can download the latest version of my E0.xls spreadsheet. The original test is still in the workbook, but now I’ve added another sheet and called it “Test 2”.
In this “Test 2” sheet, you will see a whole new set of columns. For the columns G up to K, I have simply reproduced the data within the raw data sheet E0. This is merely a convenience and allows me to manipulate the data free of the actual raw data. As mentioned in the previous post, this is always good practice.
If I wanted to make this sheet into some kind of template, I would also be tempted to turn these various columns into “names”, but I won’t go into that right now as I'm already worried that I'm going to confuse the hell out of you all.
I do realise that, for those of you who are not Excel-orientated, what I'm going to describe below might be a bit too much, in which case you may want to pass on the whole thing – but for those of you who even have some small knowledge of Excel, this is probably all understandable. I hope so anyway.
I do realise that, for those of you who are not Excel-orientated, what I'm going to describe below might be a bit too much, in which case you may want to pass on the whole thing – but for those of you who even have some small knowledge of Excel, this is probably all understandable. I hope so anyway.
Meat and Potatoes:
Right let's crack on. Columns L and M are also copies of columns in the data sheet, and are the home and away match odds. Using these helper columns, I can now start to build-up my lookups properly.
In Columns C and D, I have added a game count for each team (just a simple COUNTIF). Then using that game count and the team name, in columns A and B, I have simply concatenated (joined) these two values together to create a string that I can subsequently use to lookup previous matches. The concatenation is very simple:
cell_ref & cell_ref
For example: =IF(G13="", "", G13&C13)
We are now pretty well setup to perform our previous match lookups. To assess each team’s previous match, we need to do this:
- Generate a lookup string “on-the-fly”.
- Try and find a match for that string in the previous match data.
We have the current game number for both teams, so we need to do something like this:
String = team_name + (current game number – 1)
This is cool, because we can now go back any number of games to pick up the result from previous games. If I want to find out the result of a team’s match 6 games ago, it’s simply (current game number – 6). Columns E and F use this lookup technique to find-out if the previous game was a home game or an away game.
=IF(C22<2, "", IF(ISNA(VLOOKUP(G22&(C22-1), $A$12:B607, 1, FALSE)), "A", "H"))
Hmm, what’s all this then. Looks a bit complicated. For columns E and F I’m saying:
If the number of matches is less than two, then put an empty string there, otherwise perform a vertical lookup (VLOOKUP) of the team_name+(game number -1) on the column containing the home name lookup tags (column A). The "ISNA" bit is saying, if there is an error (in other words, it cannot be found), then that must mean there previous game was an away match, so I can put an “A” in the cell, otherwise I did find it and I can plonk a “H” there.
So, columns E and F are themselves helper columns, but I’ve already used the lookup values in columns A and B to good effect. This is essentially the same kind of lookup I will be doing to test the actual strategy.
The real good news is that all of these columns A to M that I'm talking you through can be largely ignored and you don’t really need to know how they’re constructed. I just thought it would be helpful if you did know. The actual testing of our strategy can be found in columns O to T – but you can use this sheet to test other strategies and helper columns A to M should prove useful for numerous strategy tests.
Testing our strategy:
If you look at row 33 in the spreadsheet (where I have highlighted it in yellow), I have identified Everton as a team that last played at home and lost to nil (row 25). How did I do this?
=IF(OR(H33="",F33="A", C33<2, D33<2, M33>$B$4),"", IF(AND(VLOOKUP(H33&(D33-1),$A$12:K32,9,FALSE)=0,VLOOKUP(H33&(D33-1),$A$12:K32,10,FALSE)>0),1,""))
Again, this looks much scarier than it actually is. Let’s break it down. The first part
IF(OR(H33="",F33="A", C33<2, D33<2, M33>$B$4),""
Is a set of disqualifying criteria. It’s saying: “if H33 (away team name) is empty” OR “if their last match was an away game” OR “they have played less than two matches” OR “their match odds are greater than 3.00”, then leave the cell blank. If all those criteria are met, then I can continue. The next bit:
IF(AND(VLOOKUP(H33&(D33-1),$A$12:K32,9,FALSE)=0,VLOOKUP(H33&(D33-1),$A$12:K32,10,FALSE)>0),1,"")
Is saying: “if the team’s last match resulted in a home scoreline of 0” AND “the team’s last match resulted in an away scoreline greater than 0”, then plonk a value of “1” in the cell. This then acts as a flag that we have a qualifying match. Columns Q to T then work from the fact that this is a qualifying match, and they see if laying the team in question would result in a win or not – which is essentially the same as the simple checks from my first post.
Looking at the results, we appear to have found 16 qualifying matches throughout the season, and have made £63 profit, which is an ROI of 39%. Cool.
Before we get too excited, however, there are a couple of things to note. The data from football-data.co.uk provides average odds but presumably these are Back odds, where as my strategy involves laying teams. The odds would therefore not be as favourable as I am using. Also, the number of qualifying matches is extremely low. I would need to either play with my maximum odds (if you change the figure in cell B4 you can do this yourself) to help me pull in more games, or I would need to run this strategy against an awful lot more matches. With such a small sample of qualifying matches, I am at the mercy of variance. In other words, it could just be a small hill just before the unending gradient downwards.
But once again, I haven’t spent any of my children’s hard earned inheritance (as they guy off Dragon’s Den would say) and, based on the results, I would say I need to investigate and experiment further. Or you can :-)
Hopefully, however, all this meddling has shown those of you who presently don't get involved in testing that it's really not that difficult. Once you get your hands dirty with it and build a couple of tests of your own, you will start to to get an idea of how intriguing it all is.
Even if that amazing Holy Grail of betting is not really out there and waiting to be discovered, you can nevertheless come-up with a half-decent idea and give it a thorough test against a vast amount of historic data in about twenty minutes. This will give you a reasonably definitive answer one way or the other.
Just remember, dont' go trialling it the using the fun method first!
Wednesday 10 April 2013
Testing, Testing!

If you’re like me and you’ve been
betting/trading for any length of time, then you’ll have left a large number of
“foolproof” systems, strategies, ideas and whimsies behind on the “exchange
highway” – with many of them never even having seen the light of day.
There are essentially two ways to
test a strategy or idea, one of which (in my opinion) is far safer, more
thorough, less time-consuming and generally more accurate. The other is perhaps
more fun.
The fun method is test an idea out
by trialling it with small stakes, perhaps even automating it so that you don’t
have to slavishly sit at your computer to run the actual trial. This is okay but
even with small stakes on a losing, high-turnover strategy, it’s quite easy to
trickle away a reasonable portion of your betting bank. Also the question then
becomes, how long should I run the trial for? Is one week, two weeks, two months
sufficient? What is a reasonable sample? Tricky isn’t it?
The other, and far more practical
method is to back-test any new strategy first. Now the lazy and feckless amongst
you will probably be groaning right about now.
“Hurrumph! It’s too difficult and too time-consuming
to back-test something. Easier just to try it out.”
Yes, it certainly is easier just to
throw a bet down and “see how it goes”, but even if you’re just a serious
hobbiest, this is unacceptably dumb. If you’re a professional or
semi-professional and working like that, then perhaps you need to find another
line of business.
Back-testing is admittedly no
substitute for live betting, but it can sort the wheat from the chaff before you
even embark down that road and potentially cost yourself money. I have ideas and
strategies flying around in my head all of the time. Most of them are completely
daft and fanciful, but some appear to have real worth and substance. It’s these ideas that can be dangerous unless treated properly.
“Oh my God! This idea is amazing. I can really see
this working.”
Stop right there. Don’t you dare put
a penny into the market. BACK-TEST IT!
In truth back-testing is really not that
difficult. I’ll even take you through an example of back-testing to show you
just how easy it really is.
First off, pop along to http://www.football-data.co.uk/data.php#download
where you can download several season worth of data for all the major European
leagues. This is all free-of-charge and is an amazing resource to have at your
disposal.
These data files are downloadable as
CSV files. What are
CSV files, you may be
asking? Well, these are text files where the data is separated by commas. The
acronym CSV simply stands for
Comma Separated Values. Once you click on a file and it downloads, what you need
to do is open it using Excel and save it as an Excel workbook. The reason we do
this is so that we can perform calculations on the data.
These data files are helpful to us
bettors because they contain the average odds for each match, so we can not only
see if one of our ideas will win lots of times or not, we can also see, given
the average odds, whether the idea will actually make a profit or not. That is
an amazing time-saver, isn’t it? No need to keep betting over and over to check
an idea. Here we can test against thousands of matches in a few minutes. If the
idea makes money after back-testing, well that is the time to start testing it
in the live environment!
Okay, so we’ve downloaded our test
file and we’ve saved it as an Excel workbook. We open it up and see a lot of
data in there. On the same website, there is a key to each of these fields, but
they are nearly all easily interpreted anyway.
Now so you can see a practical example of back-testing, I've provided you with a short example, In the link below, I have provided
last year’s EPL data results.
If you open it up, you will see two sheets. The
first one is the “E0” sheet. This is the raw data provided by
football-data.co.uk. You will find it good practice to generally avoid adding
formulas and calculations directly into the raw data. This is best left
untouched and a new sheet used to work out the “winning strategies” (we hope).
This way, you can apply your ideas to any set of data without having to try and
unpick all the formulas and calculations from the data.
The second sheet is what I’ve
created to help us perform our back-testing on the data. Right, so let’s suppose we want
to test the idea that there is money to be made by backing Over 2.5 goals in
every match where the odds are greater than or equal to 2.00.
Now this is
obviously a rather rudimentary example, but it should still be helpful to see
the mechanics of it all. The whole test on last year’s Premier League took me
less than five minutes. That's testing 380 matches, and I could very easily expand that out to several seasons or several leagues, allowing me to test my idea against thousands of matches.
In my “Test” sheet, I have written
in plain English what I’m testing. This is easy to forget if you open the sheet
up after a couple of months, so it’s always good to remind yourself of what
you’ve already tested. I’ve also separated-out the odds I’m testing against (C3)
so that I can change this and the results will update “on-the-fly”. This gives a
bit more flexibility. For example, odds of 2.00 might be a loser, but what about
odds of 1.90?
In the raw data sheet (E0), the odds
section begins at column X and finishes at column BS. Most of these are match
odds, some are Asians and some are the 2.5 goals odds. We’re obviously
interested in the 2.5 odds. Columns BI to BM contain “BbOU”, BbMx>2.5”,
“BbAv>2.5”, “BbMx<2.5” and “BbAv<2.5”. In order these
are:
- The number of bookies used to derive the averages
- Betbrain maximum Over 2.5 goals odds.
- Betbrain average Over 2.5 goals odds.
- Betbrain maximum Under 2.5 goals odds.
- Betbrain average Under 2.5 goals odds.
I think we’re just interested in the
averages here, so we want the BbAv>2.5 column (which is the BK
column). Right, so in column B of my test
sheet, starting at row 13, I have this formula:
=IF(AND(ISNUMBER(E0!B3),
E0!BK2>$C$3), E0!BK2, "")
What I’m doing here is checking that
the B column in the “E0” sheet contains a date. If it doesn’t, then it must be an
empty row and I can ignore it. I do this because the EPL has 380 games per
season, but the Championship and below have 552. I want to make my test sheet
“data agnostic” if at all possible.
The second check in this formula is whether the Over 2.5 odds
in the BK column of the “E0” sheet are greater than or equal to my stated odds
in C3. The little “$” marks around the C3 means it’s static, allowing me to drag
this formula all the way down the sheet and it will still refer to C3. Anyway,
if both those conditions are satisfied, then I display the actual average odds.
Column C just reports if the bet was
a winner or a loser. A “1” is a win and a “0” is a loss. The “Return” showed is
my stake (C4) multiplied by the given odds. Of course if you’re betting on the
exchange then you will also have to take commission into account (C5), which
gives us an actual P/L in column F. The final result is seen in
F10.
Unfortunately, as you can see, this
particular strategy would not have made me any money in the Premier League for
last season. It could be worth checking other leagues and other seasons to see
if there is any variation, but on the face of it, there is no edge here.
But hey, I haven’t spent a single
penny of my bank finding out the answer. And that makes the last five minutes
playing around with the data well worth my time.
In my next post, I will provide a more complex example, that performs lookups based on the previous match for each team. This also can then be used as a template for a wide variety of backtesting scenarios.
Wednesday 3 April 2013
A Game Of Two Halves
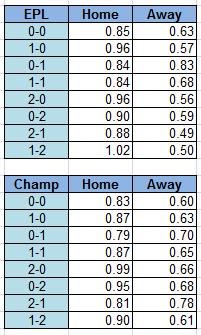
I've been looking at the English Premier League and the Championship over the last three full seasons worth of data to see how many goals are scored by both teams after a particular scoreline. Hopefully it will be helpful to some of you out there.
Okay, so the tables on the left here show the average number of goals scored by the home and away teams when the given scoreline was achieved in the first-half of the match. So, for the EPL, we can see that if the first half finished 0-0, then on average the home side will score 0.85 goals and the away side will manage 0.63.
Maybe there's nothing too amazing with all that, but there are a few points to note. For example, a first-half score of 1-2 is quite a dangerous score for any away Premier League side as it appears to trigger something of a fightback from the home side (1.02 goals). This is also reflected in the Championship, although is not quite as pronounced. In both leagues, the 1-0 and 2-0 scorelines will probably also see the home side go on to stretch their lead in the second-half.
As far as the home side is concerned, 0-1 is a bad first-half result in the Premier League, causing the away side to improve even further - while 2-1 is rather precarious in the Championship, as that causes the away side to redouble their efforts even further in the second-half.
If you're looking for the maximum number of goals in the second-half, then 0-1 is top in the Premier League (with an overall total of 1.67 goals), and 2-0 triggers most goals in the second-half of Championship matches, seeing on average 1.65 goals.

Right, another pair of tables, and this pair is unfortunately perhaps even less interesting than the dull tables above (sorry about that). These two show the number of goals scored when the first goal is scored in a particular 10 minute section. For example, in the EPL table, if the first goal is scored in the first ten minutes of a game, then on average there will be 3.69 goals in the match. Unsurprisingly, the number of goals steadily dwindles with the passage of time. Shocker, huh?
______________________________________
Subscribe to:
Posts (Atom)